
A steady but competitive market
In October, there were 358,000 recorded existing home sales, a +0.8% MoM increase and +2.9% YoY. Year-to-date sales are essentially flat at +0.1%, signaling stability rather than slowdown.
Fewer homes are hitting the market (219,618 net new listings) a –9.5% YoY drop, while 272,257 contracts were signed (+10.4% YoY). Buyers are still making moves even with tight options.
Prices: strongest at higher price points
Higher-value homes continue to drive activity, especially in the $600K+ and $1M+ range. The entry-level under $200K segment continues shrinking, making it harder for first-time buyers to compete.
The median existing home price reached $415,200 (+2.1% YoY). Regionally, the Midwest (+4.6%) and Northeast (+6.5%) saw the largest price gains, while the South and West were nearly flat (<+0.3%).
Mortgage rates and longer-term projections
Mortgage rates averaged 6.6% in Q3.
- Fannie Mae projects rates falling to 6.2% by early 2026 and 5.9% by late 2026
- MBA expects the 30-year fixed to remain between 6.4% and 6.35% through 2028
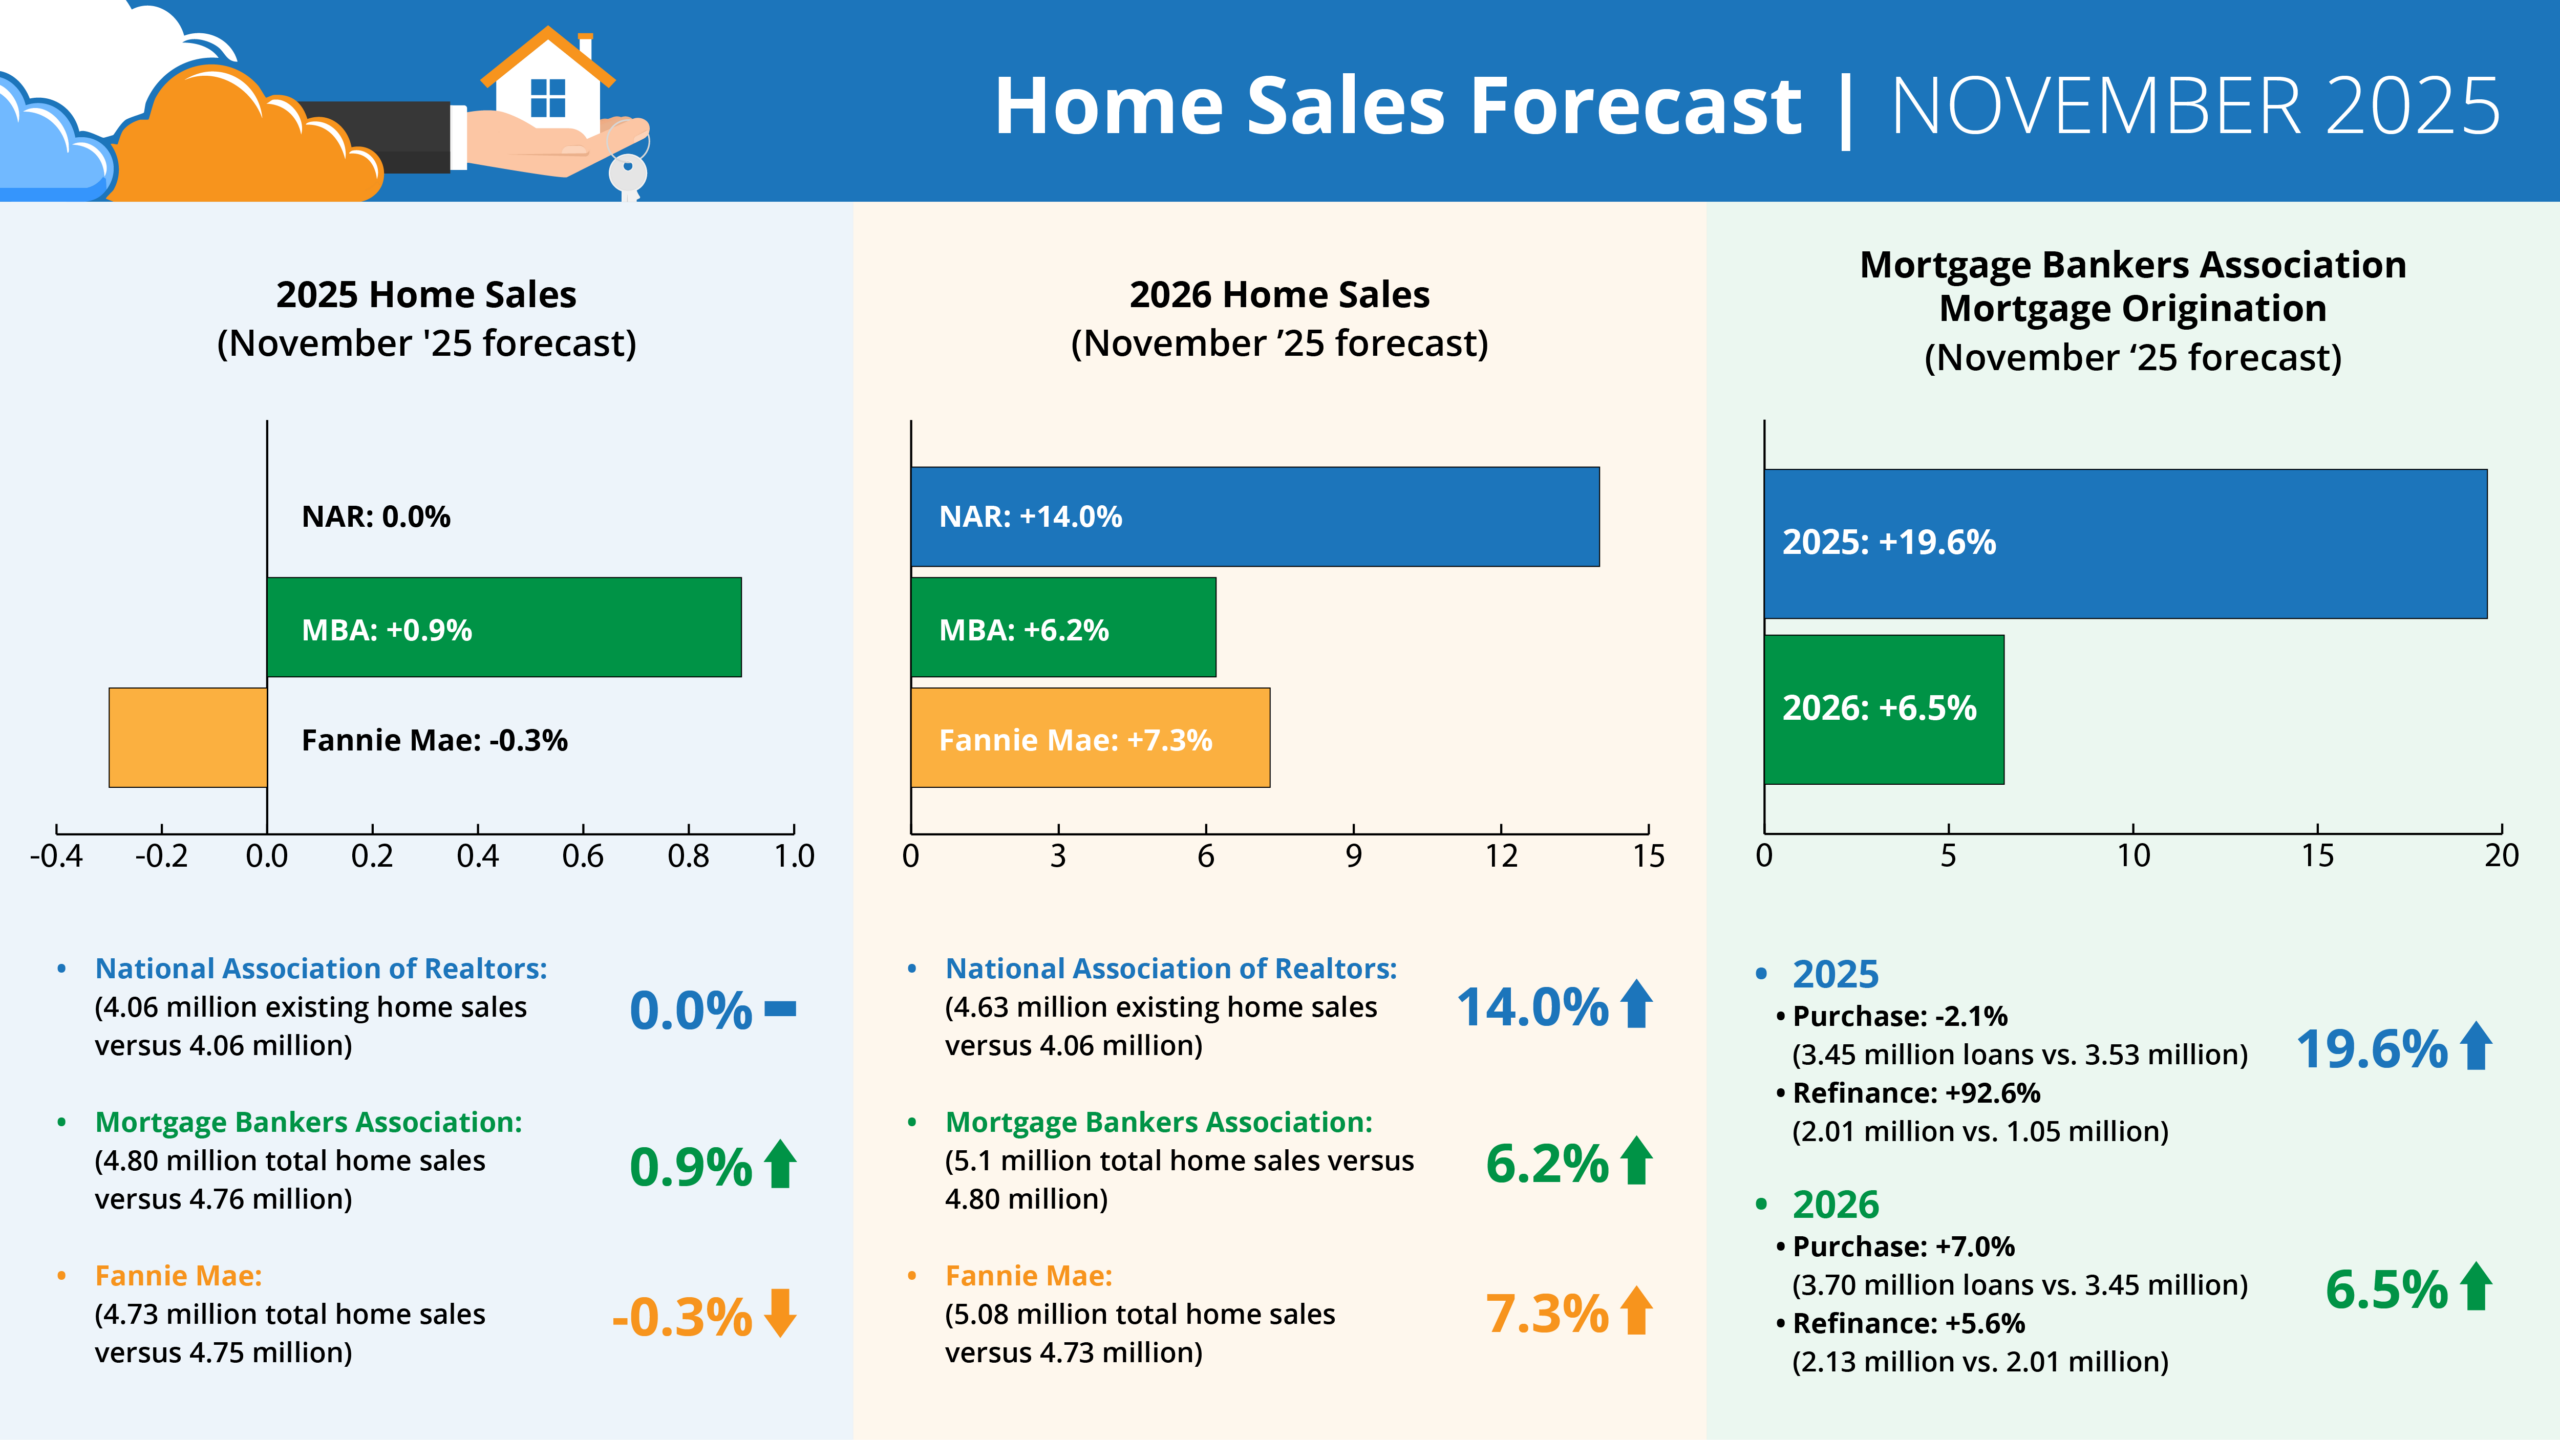
Forecasts for 2025 home sales (November ‘25 forecast)
- NAR: 0.0% (4.06 million existing home sales vs. 4.06 million)
- MBA: +0.9% (4.80 million total home sales vs. 4.76 million)
- Fannie: -0.3% (4.73 million total home sales vs. 4.75 million)
Forecasts for 2026 home sales (November ‘25 forecast)
- NAR: +14.0% (4.63 million existing home sales vs. 4.06 million)
- MBA: +6.2% (5.1 million total home sales vs. 4.8 million)
- Fannie: +7.3% (5.08 million total home sales vs. 4.73 million)
MBA forecast for mortgage originations (November ‘25 forecast)
2025 total mortgage originations: +19.6% (5.47 million loans vs. 4.57 million)
- Purchase: -2.1% (3.45 million loans vs. 3.53 million)
- Refi: +92.6% (2.01 million vs. 1.05 million)
2026 total mortgage originations: +6.5% (5.82 million loans vs. 5.47 million)
- Purchase: +7.0% (3.70 million loans vs. 3.45 million)
- Refi: +5.6% (2.13 million vs. 2.01 million)
What it means for inspectors
For solo shops, limited inventory paired with motivated buyers may keep inspections moving even as choices tighten. Stronger demand in the Midwest and Northeast may offer steadier work through the colder months.
With 2026 projected growth across all three forecasts, staying visible to agents now ensures your name is top of their list when volumes rise.