
April’s numbers are in, and the housing market is still moving.
According to the National Association of Realtors (NAR), existing home sales totaled 354,000 in April 2026. That’s +7.6% from revised March, with March revised to 329,000 from an initial 327,000, and up +1.4%YoY compared to 349,000 in April 2025.
The bigger story for inspectors is inventory. Active inventory rose to 1.47 million units in April, according to NAR, up +5.8% from March and +1.4% higher than a year ago. Zillow tracked 1.3 million active listings, also up +5.8% from March and +3.7% higher than a year ago. That marks the 28th consecutive month of annual inventory gains, according to Zillow.
Homes took a median of 17 days to go pending in April. That was one day longer than a year earlier and two days shorter than March. So yes, buyers have more to look at, but the good houses still aren’t’ sitting around waiting for someone to finish thinking about whether to buy.
Prices are still holding up nationally. NAR reported the national median existing home price at $417,700, a gain of +0.9% YoY and the 34th consecutive month of year-over-year price increases. Regionally, the Northeast led with a +4.8% gain to $510,800, while the Midwest posted +3.6% growth to $324,500. The South was nearly flat at +0.4% to $366,600, and the West was down -1.4% to $619,600.
On the financing side, Fannie Mae and the Mortgage Bankers Association (MBA) continue to project 30-year mortgage rates in the mid-6% range through 2026-2027. Fannie Mae expects an average of 6.3% in 2026 and 6.2% in 2027. MBA forecasts 6.1% in Q1 2026, rising to 6.4%–6.5% through year-end, and 6.5% in 2027. The Freddie Mac weekly average was 6.18% in March, rising to 6.46% in early April before dropping back to 6.23% by late April.
NAR reported 4.02 million existing home sales on a seasonally adjusted annual rate basis for April 2026, up +0.2% from revised March at 4.01 million and flat YoY compared to April 2025 at 4.02 million.
Current Forecasts
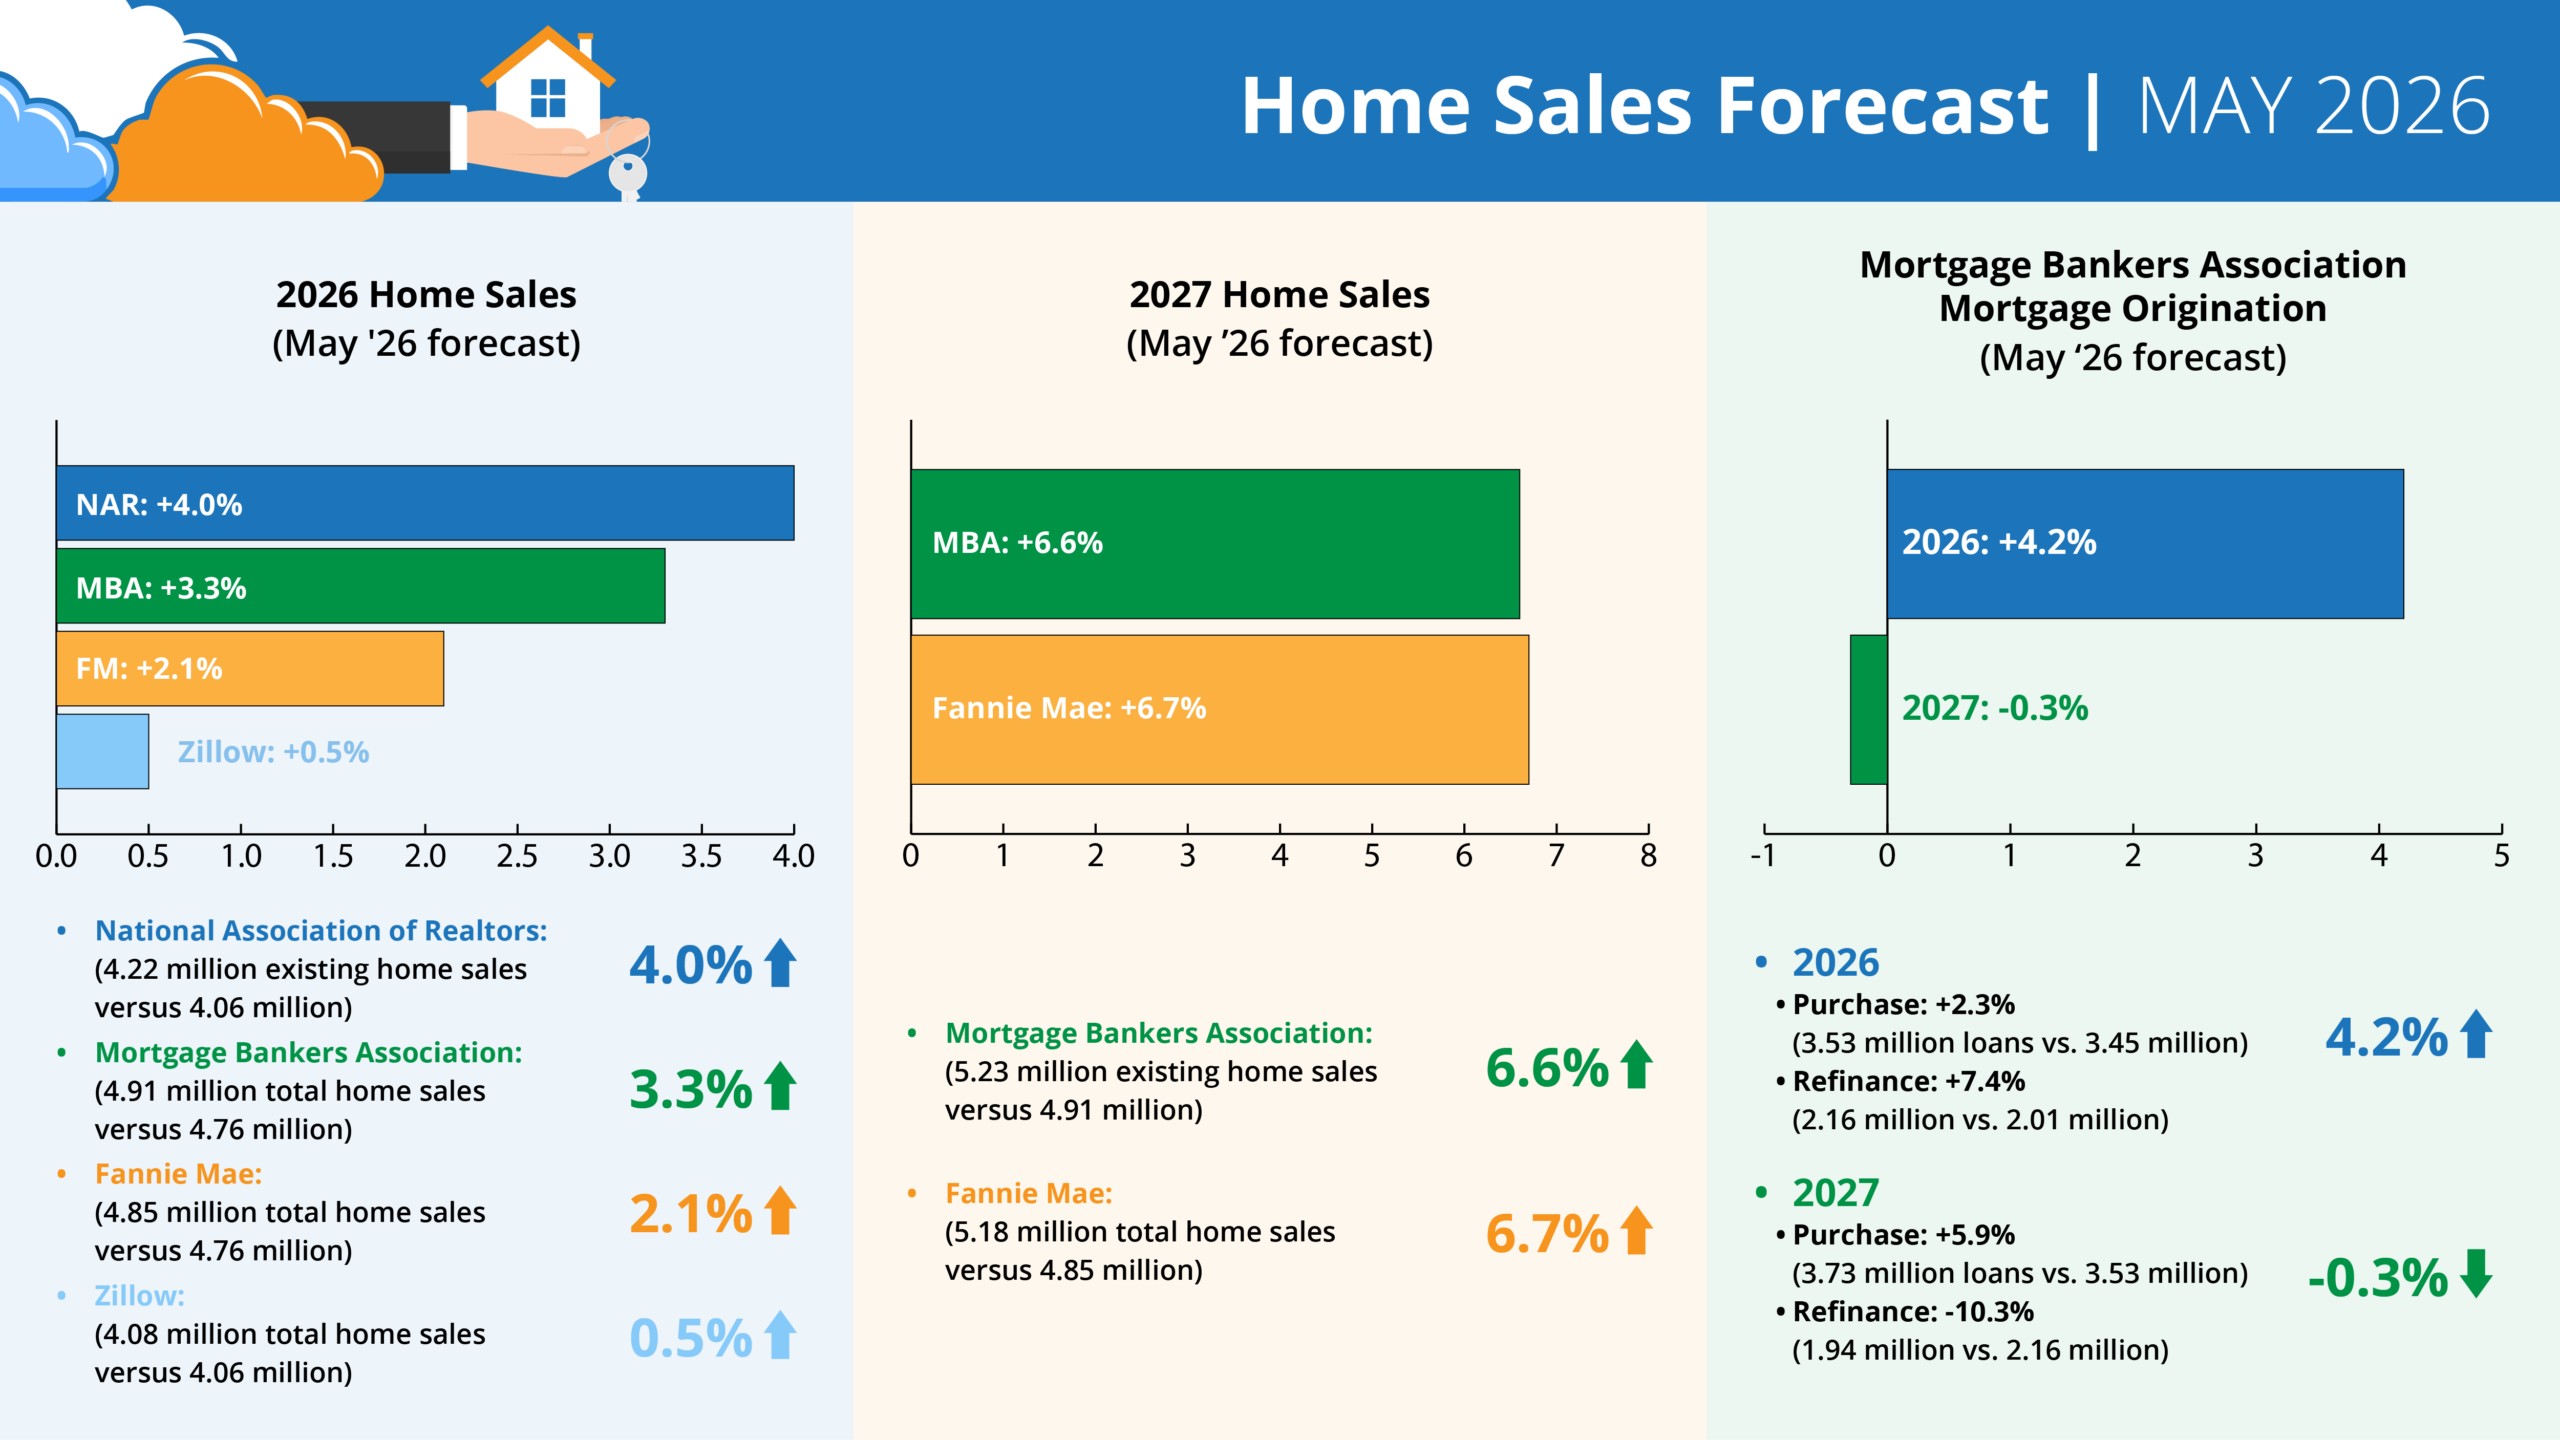
Forecasts for 2026 Home Sales (May ’26 forecast)
- NAR: +4.0% (4.22 million existing home sales vs. 4.06 million) – revised April 2026
- MBA: +3.3% (4.91 million total home sales vs. 4.76 million) – May ’26 forecast
- Fannie: +2.1% (4.85 million total home sales vs. 4.76 million) – May ’26 forecast
- Zillow: +0.5% (4.08 million existing home sales vs. 4.06 million) – May ’26 forecast
Forecasts for 2027 Home Sales (May ’26 forecast)
- MBA: +6.6% (5.23 million total home sales vs. 4.91 million) – May ’26 forecast
- Fannie: +6.7% (5.18 million total home sales vs. 4.85 million) – May ’26 forecast
MBA Forecast for Mortgage Originations (May ’26 forecast)
- 2026 Total Mortgage Originations: +4.2% (5.69 million loans vs. 5.46 million)
- Purchase: +2.3% (3.53 million loans vs. 3.45 million)
- Refi: +7.4% (2.16 million vs. 2.01 million)
- 2027 Total Mortgage Originations: -0.3% (5.67 million loans vs. 5.69 million)
- Purchase: +5.9% (3.73 million loans vs. 3.53 million)
- Refi: -10.3% (1.94 million vs. 2.16 million)
Bottom line for inspectors
The market is still steady, but the inventory story keeps getting better. More homes for sale give buyers more options and give inspectors more chances to get on-site. With rates still expected to sit in the mid-6% range, buyers are likely to stay careful, which means clear inspection reports matter. For solo inspectors, this is the time to keep your report writing process tight, your schedule ready, and your gear where you can actually find it.